|
Mark HASEGAWA-JOHNSON 1, Jul Setsu CHA 2, Shamala PIZZA 3 & Katherine HAKER 4
1 University
of California at Los Angeles and CITIDEP USA. E-mail: mhj@icsl.ucla.edu
2 University of California at Los Angeles
3 University of California at Los Angeles
4 Cedars-Sinai Hospital Department of Radiology
ABSTRACT
CTMRedit (affectionately known as MRCAT, or 'Mr. Cat") is a software tool for displaying, editing, and three-dimensional reconstruction of MR and CT images. This paper describes the incremental evolution of MRCAT during a period in which it was used regularly by the two software designers, and by two medical experts naive with respect to the software design. Three methods were found to be useful for suggesting changes to the software: use of the software, and conversations with other users, were helpful for identifying useful new functionality, while direct observation of naive users was most useful for identifying problems with the existing user interface. As expected, naive users are generally most efficient when presented with a familiar-looking user interface, e.g. radiologists are familiar with film, so images on screen should be smoothly interpolated so that they look like film. An unexpected finding is that not all of the software implementation details should be hidden. Implementation details which the user must know, e.g. organization of an image database, should be displayed prominently in the user interface, so that they will quickly become familiar to the user.
This paper describes the development of a relatively complicated user interface tool. During its development, the tool was in active use both by its programmers, and by two medical experts completely naive to the software design. The juxtaposition of expert and naive users in the development of the software allowed insights which may perhaps be generalized to other user interface design problems.
The software described in this paper grew out of a research program in the use of modern three-dimensional magnetic resonance (MR) imaging tools for the analysis of human speech production. The final goal of the research is an anatomical, acoustic, and statistical analysis of the shape of the tongue during production of the eleven non-reduced vowels of Western U.S. English. (These are the vowels in the words beat, bit, bait, bet, bat, boot, put, boat, but, father, and Bert. One subject, from the Eastern United States, was able to distinguish the open vowels in father and bought, and was therefore imaged for both vowels separately.
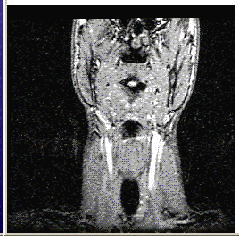
Figure 1: Coronal image slice, 24cm field of view, located just anterior to the bend in the throat, imaged during production of the vowel /a/ as in "father."
Figure 1 shows a typical coronal image slice obtained using MRI. This slice is located just anterior to the bend in the throat; the area in the image is a 24cm square, and the grayscale values represent the density of soft tissue in a coronal slice with a thickness of 3mm. For each vowel, coronal image slices were collected with a spacing of one image slice per 3mm, from the front of the lips to the back of the throat, for a total of about 36 coronal images per subject. Axial image slices were also collected with a spacing of one slice per 3mm, ranging vertically from the top of the mouth to a point just below the vocal folds, for a total of about 45 axial images per subject. Thus for each of the five subjects, 11 vowels were imaged; for each vowel, 36+45=81 image slices were collected, yielding a total of 5 X 11 X 81=4455 image slices.
In the image shown in figure 1, there are five black air cavities visible in the head and neck. From top to bottom, they are the sphenoid sinus, the nasopharynx, the mouth, the larynx, and the trachea. The tongue is visible as the bottom border of the mouth cavity. The first step in MRI research consists in drawing a line on the computer screen to mark the position of the tongue, and saving this ``segmentation'' information for later use.
The second step in the proposed research program is to gather segmentation information from all of the images of a single vowel, and interpolate the segmentation information to obtain a single three-dimensional tongue shape. This is not as easy as it sounds. When the MR images are properly displayed, it is possible to draw an outline of the tongue which is accurate to within about 0.25mm within the image plane. The spacing between the image planes, however, is 3mm. This means that if a ``tongue object'' is created by just stacking up the lines drawn in each of the 36 coronal image slices, the resulting object has a precision of about 0.25mm in the vertical and left-right dimensions, and a precision of only about 3mm (more than ten times worse!) in the front-back direction. What is needed is some sort of interpolation algorithm, which can smooth the ``tongue object'' in the front-back direction in as accurate a fashion as possible.
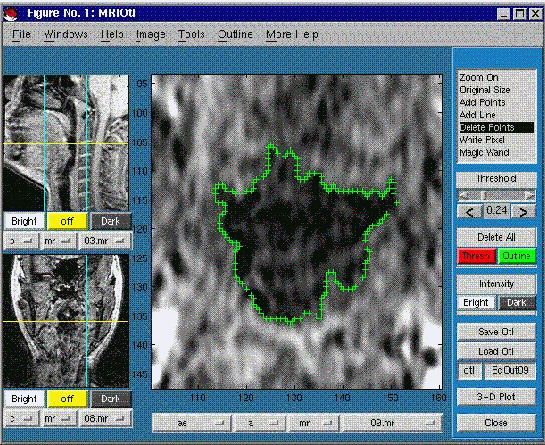
Figure 2: CTMRedit editing window display. The main window shows a zoomed axial view of the throat. 'X' marks on the main image show an outline of the throat, which was created using the ``Magic Wand'' tool and the ``Delete Points'' tool. Sagittal and coronal locator images are on the left. The position of the main image is shown with a horizontal ``locator line'' on each locator image, and vertical ``zoom lines'' show the extent of the main image window on each locator image.
The CTMRedit software (also affectionately known as ``MR-CAT'') was designed to allow medical researchers with no knowledge of the algorithms in use to easily segment individual MR images, and to easily reconstruct a three-dimensional tongue model from the segmented image data. Source code for all of the software is freely available, at the web address ``http:// www.icsl.ucla.edu/ ~spapl/ CTMRedit/ index.html''. Prospective users should note, however, that CTMRedit is written in the matlab programming language, and that matlab is a commercial product. For more details about matlab, see ``http://www.mathworks.com/''.
A photo of the main MRCAT user interface window is shown in figure 2. The features of the software are:
1. CTMRedit can read and write standard 8-bit images (including JPG, BMP, TIFF, and GIF), and it can also read and write images in the 16-bit GE MR image format. The CTMRedit display routines assume that images have a 16-bit intensity scale (65536 levels), but that the monitor only has an 8-bit intensity scale (256 grayscale levels). CTMRedit allows the user to brighten or darken an image to enhance the contrast of interesting features, in a manner similar to the functionality of NIH image (Rasband and Bright, 1995).
2. When loading a "main image," CTMRedit also looks for images of the same subject in orthogonal image planes, which can be displayed next to the main image as "locator images." As a result, if the user needs to segment some area from an axial image, he/she can use information from both the coronal and sagittal images to help identify and eventually segment the axial image. A "locator line" is drawn on each locator image to mark the location of the main image plane, and "zoom lines" show the edges of the main image window. Both of these lines are calculated using an auxiliary text file (the ".cor" file) in which the user has specified positions of 4 corners of the image plane in 3D Cartesian coordinates. When CTMRedit is started, it searches for images in a format it understands, loads one, and lists the full path of the loaded image in a series of popup menus. The user can easily navigate a large image database by choosing new files or new directories using these popup menus.
3. Tools for editing ROI (region of interest) outlines are also user-friendly. Tools include the "add point," "add line," and "delete region" tools, and a "magic wand," which uses a seeded region-growing algorithm to automatically outline a dark region selected by the user.
4. To avoid a "pixelly-looking" display, images in CTMRedit are upsampled and interpolated to the resolution of the user's monitor. With an upsampled main image, it is possible for users to draw an ROI outline with errors that are smaller than the size of an image pixel. For example, water-filled test tubes with known radii of 3.9mm, 7.8mm, and 11.4mm were imaged using MRI, with an image pixel size of 0.9375mm. CTMRedit outlines, combined with a least-squares fitting technique, yielded radius estimates with an average error of only SE=0.20 pixels.
1. Two comparisons will show the advantages of a pixel upsampling approach. First, a theoretical analysis: without pixel upsampling, the smallest possible error is an error which is uniformly distributed between -0.5 and +0.5 pixels. The root-mean-square of this distribution is SE=0.29 pixels, or 50% more than the error obtained using CTMRedit. Second, an experimental analysis: standard pixel-counting areas obtained using the same three test tubes, without image upsampling, yielded a root-mean-square radius error of SE=0.37 pixels, which is almost twice as much as the error obtained using CTMRedit.
5. Once a series of image planes have been segmented, the segmentation contours can be converted into a three-dimensional object using any one of several included interpolation schemes, and plotted in three dimensions using the included ``plot3d'' widget. There are three interpolation schemes included in the package, designed for the following three tasks:
a. A locally-linear interpolation scheme, designed to connect two open curves to form an open surface in three-dimensional space.
b. A ``shape-based interpolation'' scheme, based on the work of Raya and Udupa (1990), which connects closed curves in order to form a cylindrical or other closed surface in three-dimensional space.
c. A second ``shape-based interpolation'' scheme, which fills in the object, providing the user with an image of a solid space-filling three-dimensional object.
This section describes the methods which the designers of CTMRedit applied to ensure rapid development of a relatively easy-to-use user interface.
When the research program described in section II was initiated, all of the development of CTMRedit, together with most of the MR image segmentation and interpretation, was primarily the responsibility of two electrical engineers (authors MH and JC). We considered two possible models of the divisions of labor:
1. In the first model, one of the two engineers writes and debugs the software, while the other uses the software. This model has the advantage that responsibilities are easily assigned: if the software is not working, it is the fault of the first engineer, while if the MR segmentation is behind schedule, it is the fault of the second engineer.
2. In the second model, both of the engineers spend about half of their time writing and debugging software, and about half of their time using the software to segment MR images. The advantage of this model is that, as users of their own software, the authors are placed in situations in which even the most subtle software bugs become apparent. When a software author notices a bug, he or she often is able to fix it immediately, without extra consultation.
Initially, we adopted the second model, in which both authors were also half-time users of the software. A pure ``model 2'' approach became rapidly untenable, however, because it was never clear who was responsible for which section of code.
The solution which finally worked was a mixture of model 1 and model 2, as follows:
* One of the authors (MH) spent half of his time maintaining the existing software, and about half of his time as a user.
* The other author (JC) spent about half of her time as a user, and about half of her time developing new features for the software. When the features developed by JC were ready to be integrated into the complete CTMRedit package, MH took responsibility for the integration.
It is often the case that a user interface metaphor which the designer considers easy to use will be viewed as confusing and difficult by naive users. For this reason, it is important that the software designers should be in constant contact with frequent users of the software who have no understanding of or interest in the implementation details.
If the software is designed for a biomedical function, as is CTMRedit, it is also useful to engage frequent users with biomedical expertise. Biomedical experts who are naive about software implementation frequently notice behaviors of the software which, although they make sense from the perspective of a computer scientist, are completely nonsense from the perspective of a medical practitioner.
CTMRedit was aided by the advice of two specialists. Dr. Haker, a radiologist, consulted with the software authors on several occasions in order to help with the MR image segmentation, and in the process she provided valuable advice on the design of a user interface for the task. Similarly, Dr. Pizza, an orthodontist, provided expert consulting on the shape and positioning of structures in the oral cavity. Dr. Pizza was able to help with the segmentation weekly for several months, and provided insight on several revisions of the software.
In the development of CTMRedit, we noticed three very different types of software problems, which yielded to three very different methods of solution. In order of increasing complexity, the three types of problem are ``bugs'' (coding errors), communication gaps, and functionality gaps.
Coding errors are fixed most rapidly and most efficiently if the authors of a software package are also users.
It is not sufficient for a software author to start up the program and run a few test scripts, since many bugs will only come to light after unusual combinations of input, or in unusual modes of operation. We found that the only way to reliably ferret out all of the coding errors in a new software release is to require the authors to spend about one day per week trying to accomplish non-trivial, real-world tasks using the software. In our case, both of the authors used the software at least one day per week to view and segment MR images.
Occasionally, a bug will be difficult enough that the authors are not able to immediately fix it. In this case, it is useful for the authors to consult with naive users of the software, to find out just how important the bug really is.
For example, CTMRedit suffered from a bug in which the ``Add Line'' ROI editing tool failed to disarm itself when another editing tool was selected from the menu, with the result that under certain circumstances, the user found herself adding lines that she did not wish to add. The software authors were aware of this bug for three weeks, but did not consider it important enough to fix until it was reported by one of the naive users.
When the software fails to perform as the authors intended, we call the problem a ``bug;'' bugs are usually easy to identify and fix. A more difficult class of problem occurs when the software performs as intended, but the intended function is difficult for a naive user to understand or use. This class of user interface problem may be called a ``communication gap,'' because it usually represents a lack of communication between the software designer and the naive user.
Communication gaps are difficult to diagnose because, by definition, the software designers do not know that they exist. A communication gap may be diagnosed in one of two ways:
* Sometimes, a naive user will notice that she is having trouble using a particular feature of the software, and report it to the authors.
* More often, a naive user will not even notice that there is a problem, but the problem will be obvious when authors of the software watch the user trying to navigate the package's user interface.
The smooth, upsampled zooming feature of CTMRedit is the solution to a ``communication gap'' which was diagnosed through user feedback. When CTMRedit was first written, the electrical engineers designing the software mistakenly assumed that the size of a pixel is an important parameter of MR imaging, and that the boundary between one pixel and the next should therefore be displayed as clearly and discretely as possible on any zoomed image. When our medical expert users tried to use the software, however, they complained about the ``pixelly'' look of the zoomed images, and they pointed out that radiological film has a ``smooth'' look even when it is magnified far beyond the resolution of the film. Taking their advice, we implemented a smooth zooming feature in CTMRedit, which simulates the zooming characteristics of radiological film.
The menu-based navigation system of CTMRedit is the solution to a ``communication gap'' which was diagnosed through observation of naive users. CTMRedit allows users to rapidly view images stored in a tree-structured database. The authors of the software have always used it to navigate rapidly through the tree structure, but when it was first deployed, naive users did not even know that the tree structure exists. Since the naive users were unaware of their missing knowledge, they were unable to report any problems with the software. The problem was finally diagnosed when one of the authors (MH) noticed one of the expert users (SP) completely exiting and re-starting the software in order to change to a new image series.
The solution to this particular ``communication gap'' seems, on the surface, to violate one of the usual maxims of user interface design. User interface designers usually try to organize the interface to each software package around a single unifying ``metaphor'' --- thus for example, a windowing system might be organized around the metaphor of a desktop, complete with file cabinets, an in/out tray, and a garbage can. Since all user interface elements are organized around a single metaphor, the reasoning goes, any details of software implementation which do not conform to this metaphor should be hidden from the user. The metaphor employed by CTMRedit is the metaphor of multiple orthogonal ``views'' of a single subject, arranged in a layout somewhat similar to the layout of a police identification blotter. In order to enhance this metaphor, the structure of the database was initially hidden from users.
Even though the tree structure of the database is an ``implementation detail,'' however, it turned out that knowledge of this particular implementation detail greatly facilitates use of the software. In order to facilitate use of the software, therefore, the entire user interface was redesigned in order to prominently display the database structure in the form of a series of pop-up menus, so that users will always know exactly how the image they are currently viewing fits into the database as a whole. Users can move to a different part of the database by simply choosing a destination on any of the pop-up menus; if they want to come back, they always know which menu was changed, and they are always able to change the menu back to its original reading.
During the development of CTMRedit, we found that the most difficult type of software problem is a gap in functionality. Sometimes, despite a perfectly logical user interface and error-free coding, a software package can not be used in its intended target application because one of the required steps has not been implemented.
A functionality gap is important because, in many cases, it can only be solved by writing and debugging a lot of new code. Writing and debugging new features for a software package is time consuming, and should not be attempted until the authors, the users, and any other interested parties understand the time commitment involved.
CTMRedit's ability to interpolate regions of interest in three dimensions is the solution to an important initial functionality gap. CTMRedit was originally written as a package for viewing MR and CT images, and for segmenting regions of interest in two dimensions. The research project for which CTMRedit was written also requires the ability to interpolate regions of interest in three dimensions, but we believed initially that this added functionality would be relatively easy to implement.
One of the authors (JC) researched the requirements of three-dimensional interpolation, and discovered that this added functionality was likely to require a lot more new code than we initially anticipated. The authors consulted with each other, and with the medical expert users, in order to determine the order in which different types of 3D interpolation should be added to the software. Shape-based interpolation of closed surfaces was added first, followed by linear interpolation of open surfaces, and finally by shape-based interpolation of solid objects. More interpolation, and better tools for handling three-dimensional objects, are likely to follow in the future.
This paper reports a single, small-scale software development project. Many issues which are important in larger projects have not been addressed, and we have had only limited opportunities to compare different methods for solving the same problem. Despite these limitations, we believe that the following findings will probably generalize to new and larger development projects:
* Coding errors are most rapidly and efficiently fixed if the authors of the software are also users. We found that, in order to be reasonably confident that they have uncovered most bugs, authors of software should spend at least 4-8 hours per week using their own software to solve non-trivial, real-world problems.
* Even when tasks are distributed among several engineers (e.g. when each engineer is both software author and software user), there must be one person who is in charge of integrating new features into each software package, and of maintaining that package in working order.
* ``Communication gaps'' can only be identified when naive users uninterested in the implementation details make frequent use of the software. Communication gaps may be identified either by discussing the software with naive users, or by watching while a naive user tries to navigate the user interface.
* As has been noted by previous authors, most implementation details should be hidden behind a uniform user interface metaphor. Occasionally, however, the knowledge of particular key implementation details will greatly facilitate use of the software. Rather than being hidden, these key implementation details should be prominently displayed on the user interface. Prominent display allows the user to become rapidly, easily, and even sub-consciously familiar with these key implementation details.
CTMRedit is a 3-plane, 16-bit, easy-to-use tool for medical image viewing, ROI editing, and 3D contour interpolation, written in the commercially available matlab programming language. CTMRedit is available for free, from the web site
| http://www.icsl.ucla.edu/~spapl/CTMRedit/index.html |
The development of CTMRedit was supported by post-doctoral fellowship number DC 00323-01 from the National Institutes of Health, and by a grant from the National Science Foundation.
Matlab is a registered trademark of the Mathworks, Inc., Natick, MA. The authors of CTMRedit and of this paper have no affiliation with or financial interest in the Mathworks.
W.S. Rasband and D.S. Bright (1995), "NIH Image: A Public Domain Image Processing Program for the Macintosh," in Microbeam Analysis Society Journal, vol. 4, pp. 137-149.